Activity summary
For each period selected, the system adds employees' various totals in days for each activity total/cost centre selected.
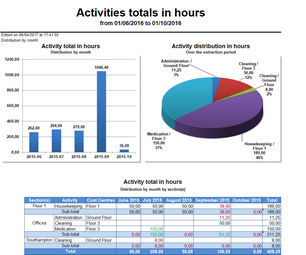
The report populates the model file with several tabs:
•DataGraphic: Period, Total activities selected over the period
•DataPieChart: Description of the activity/cost centre, Activity total/cost centre over the period requested for the selected population
•Graphic: Description of breakdown level, Description of month/year, Activity value/cost centre for the period, Total of all accounts displayed for the line, Sub-total for each month by breakdown level, general total for each column
|
•If an activity/cost centre does not have a total for the whole period requested for a breakdown level, then this activity is not displayed. •If an activity/cost centre has at least one total different from 0 in a month for a breakdown level, then the system displays that activity/cost centre. |


