Special hours summary
For each period selected, the system adds employees' various totals in days for each special hours account selected.
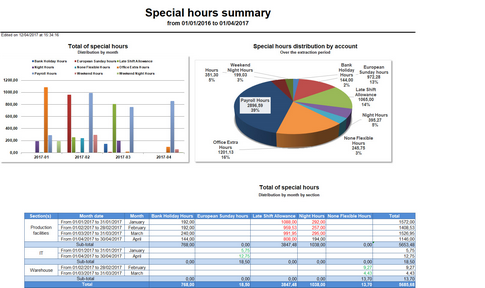
The report populates the model file with several tabs:
•DataGraphic with, for each period selected and each special hours account selected:
Period, Special hours accounts, Total (total special hours account for the period)
•DataPieChart:
Special hours account, Value (account total over the requested period for the selected population)
•Graphic, by department and by breakdown period:
Breakdown level, Value for the special hours account selected, Total of all accounts, Sub-total for each account, General total for each column

